
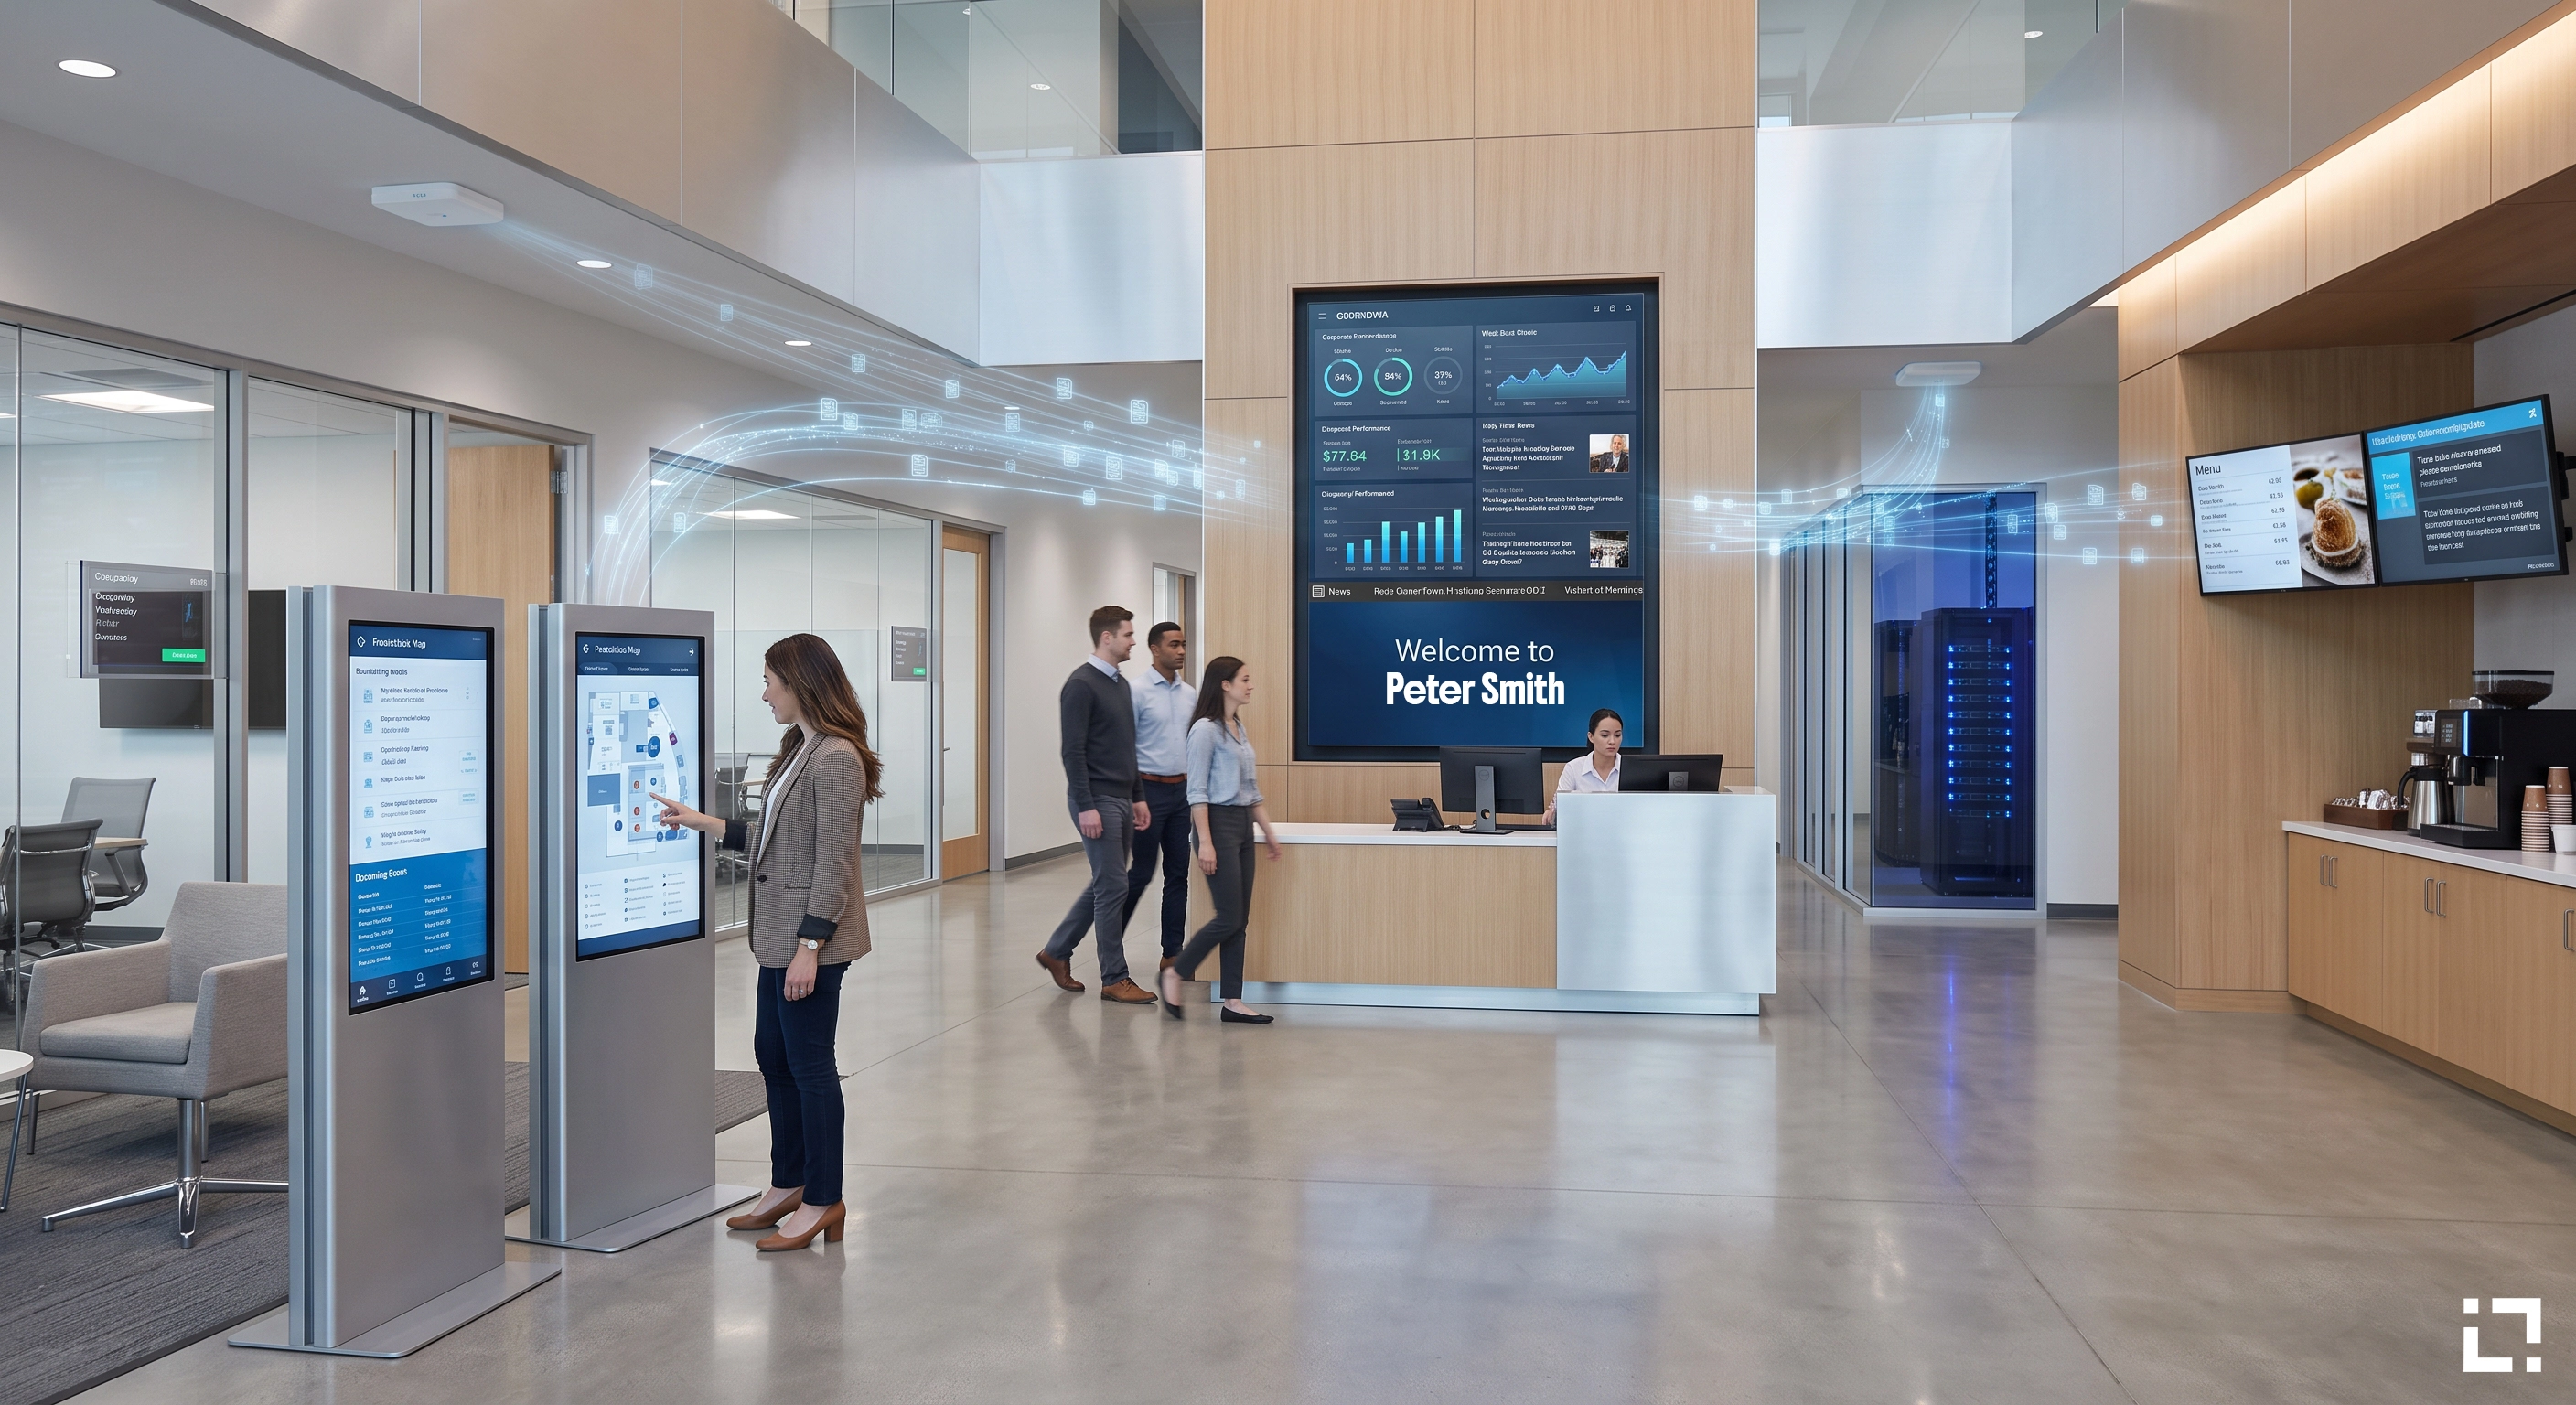
A retail chain runs 60 screens across 12 locations. Each screen shows a looping playlist built six months ago. The promotions are outdated, the store hours are wrong for two branches, and nobody knows which slides anyone actually looks at. The screens are on. The strategy is not.
This is the gap that separates digital signage as infrastructure from digital signage as a communication channel. The hardware is rarely the problem. The content strategy — who decides what runs, when, for whom, and how results are measured — is almost always where things break down.
Why Most Signage Content Fails Before It Goes Live
The default approach to signage content is to treat it like a brochure: design once, deploy, forget. This works for a week. After that, content ages, context shifts, and the screen becomes visual noise that people learn to ignore.
Digital signage has a message recall rate of 83%, which is significantly higher than email or print. But that figure assumes the message is relevant to the person seeing it, at the moment they see it. Irrelevant content does not benefit from the medium. It just occupies the space.
Three structural problems drive most failed strategies:
Static scheduling — playlists built on fixed rotations with no link to real-world events, inventory, or audience behavior. A promotion that ran last month still runs today. A price that changed in the ERP still shows the old value on screen.
No feedback loop — screens go live and stay live with no mechanism to measure what works. There is no data on dwell time, interaction rate, or content completion. Decisions about what to show next are based on gut feel.
Centralized bottlenecks — every content update requires a designer, a file, an upload, and a manual schedule change. In a network of 20 or 50 locations, this creates a permanent backlog and guarantees stale content.
What a Measurable Content Strategy Actually Looks Like
A content strategy that produces results starts with a question most teams skip: what does success look like, and how will we know when we have it?
That question forces three planning decisions before a single slide is designed.
Define the content objective by zone. A screen at a building entrance serves a different purpose than a screen at a checkout queue or inside a meeting room corridor. Entrance screens build awareness. Queue screens reduce perceived wait time and drive secondary purchases. Corridor screens communicate operational information. Each zone needs its own content logic, its own update frequency, and its own success metric.
Map content to data sources. If a promotion depends on inventory levels, the screen should pull from the inventory system, not from a manually updated slide. If a meeting room display shows availability, it should connect to the calendar, not to a static schedule someone updates on Mondays. Mapping content to live data sources is what keeps a network of screens accurate across dozens of locations without manual intervention.
Set measurable benchmarks. Engagement rate, interaction rate, content completion, dwell time — the right metric depends on the screen type and the objective. What matters is that you define it before launch, not after.
Scheduling Content Around Context, Not Just Time
Content scheduling is often treated as a calendar problem: show this at 9am, that at 2pm. Time-based scheduling is necessary but not sufficient. The more powerful variable is context.
Context-aware scheduling means content changes based on conditions: footfall density, weather, stock levels, the outcome of the last transaction, the profile of the person standing in front of the screen. A coffee brand shows hot drinks when the temperature drops below 10°C. A bank branch shows mortgage rates to customers who have just been identified as homeowners in the CRM. A factory floor shows shift-specific KPIs to the team starting their rotation.
This kind of scheduling requires integration between the signage platform and the data systems that hold the relevant context. It also requires a content design approach that separates layout from data — so the template stays fixed while the values update automatically.
In manufacturing environments, closing this loop between live operational data and screen content has been linked to a 41% reduction in quality defects. The mechanism is simple: when the right information reaches the right person at the right moment, decisions improve.
Building Signage Content Ideas That Scale Across Locations
Scaling a content strategy across multiple sites is where most approaches collapse. The instinct is to centralize everything — one team, one content library, one approval chain. The result is a bottleneck that makes local relevance impossible.
A scalable approach separates global from local. Global templates define brand standards, layout rules, and data-driven zones that update automatically from central systems. Local zones within the same template allow each site to surface its own content — local events, local staff recognition, local operational data — without touching the global structure.
This is the model behind Livesignage's no-code Experience Designer: a visual engine where the structure is defined once and the content adapts by location, by audience segment, by trigger. Design teams control the brand layer. Operations teams control the data layer. Neither has to wait for the other.
Across a network of retail and corporate deployments using this approach, the reduction in manual content edits reaches 73%. That is not a marginal efficiency gain — it is the difference between a strategy that is maintained and one that is abandoned.
How Analytics Closes the Loop
A digital signage content strategy without analytics is a hypothesis that never gets tested. You designed the content, you scheduled it, you deployed it — but you do not know if it worked.
Analytics in signage operates at several levels. Impression data tells you how many people were exposed to a piece of content. Interaction data tells you how many engaged with it. Conversion data — when the signage platform is integrated with a POS, a booking system, or a CRM — tells you what happened next.
The combination of these layers is what allows a strategy to improve over time. If a product promotion drives high impressions but low conversion, the problem is either the offer or the creative. If interaction rates spike at certain times of day, that is information about when to schedule high-priority content. If a specific screen in a specific location consistently underperforms, that is a signal about placement, audience, or content relevance.
When these analytics are connected to a platform that can act on them — adjusting schedules, triggering content variants, updating data-driven fields — the feedback loop becomes operational, not just informational. Deployments built on this model have recorded an 85% increase in engagement compared to static, manually managed networks. The driver is not better creative. It is the alignment between content, context, and measurement.
Where to Start if Your Current Strategy Is Not Delivering
If your screens are running but you cannot answer the question "which content is working and why," the strategy needs to be rebuilt from the measurement layer up.
Start by auditing what you have: how many screens, what content types, what data sources are theoretically available, and what success metrics have never been defined. Then identify one zone — a single location, a single screen type — where you can run a controlled test with defined objectives and a measurement mechanism.
That test will tell you more than six months of intuition-based scheduling.
If you want to see how a platform built for this kind of structured, data-driven content strategy works in practice, you can book a demo with a Livesignage specialist and walk through a deployment scenario relevant to your network.